Draw#
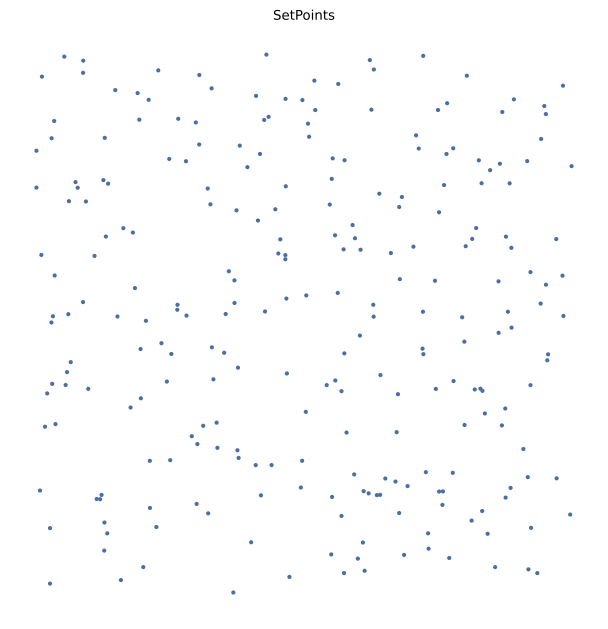
Draws 2D points using Matplotlib.
This method provides flexible visualization of point sets with customizable styling options.
Parameters#
figsize (tuple of (float, float), optional): Figure size in inches. Default (6, 6).
v_size (float, optional): Marker size for points. 0 disables scatter. Default 8.
v_color (str, optional): Point color passed to Matplotlib. Default “#00072D”.
v_alpha (float, optional): Point alpha (transparency) in [0,1]. Default 1.
title (bool, optional): Whether to set a title. Default True.
fontsize (float, optional): Title font size. Default 10.
details (bool, optional): If True, appends self.details to the title (if present). Default False.
axis (bool, optional): If True, show axes. Default False.
save (str or None, optional): If set, saves a “.png” at save + “.png”. If None, returns (fig, ax).
Other Parameters#
fig_kwargs (dict, optional): Extra keyword arguments passed to matplotlib.pyplot.subplots.
v_kwargs (dict, optional): Extra keyword arguments passed to ax.scatter. These override v_size, v_color, v_alpha if duplicated.
title_kwargs (dict, optional): Extra keyword arguments passed to ax.set_title. These override fontsize if duplicated.
savefig_kwargs (dict, optional): Extra keyword arguments passed to matplotlib.pyplot.savefig.
Returns#
(fig, ax) (tuple): Matplotlib figure and axes objects.
Raises#
ValueError: If points are not 2D.
Example#
from proximitygraphs.points import SetPoints

points = SetPoints.uniform_square(n=200, seed=42)

# Basic plot
fig, ax = points.draw()

# Customized plot
fig, ax = points.draw(
    figsize=(10, 10), v_size=20, v_color="red", v_alpha=0.6, title=True, axis=True
)

# Save to file
points.draw(save="my_points")  # Saves as 'my_points.png'
Example#
import proximitygraphs as pg

pts = pg.SetPoints.uniform_square(n=250, seed=7)

pts.draw(figsize=(8, 8), v_color="#00072D", v_size=10, details=True)