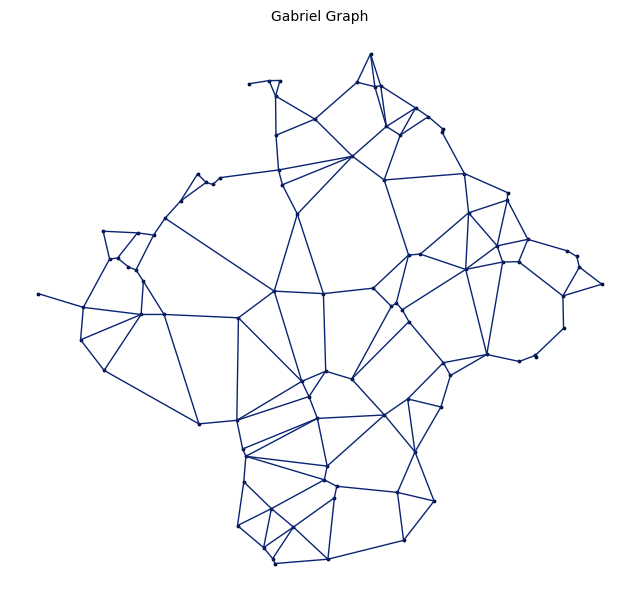
import numpy as np
import proximitygraphs as pg
from proximitygraphs.experiments import Experiment
EXAMPLE 1: Basic Experiment - Comparing Gabriel vs RNG#
def example_basic_comparison():
    """Compare Gabriel Graph and RNG on uniform point sets."""


    exp = Experiment(
        name="Gabriel vs RNG on Uniform Points",
        point_config={
            'method': 'uniform_square',
            'params': {'n': 100}
        },
        graph_configs=[
            {'class': pg.GG, 'params': {'closed': True}, 'name': 'Gabriel'},
            {'class': pg.RNG, 'params': {'closed': False}, 'name': 'RNG'}
        ],
        n_simulations=30,
        seed=42,
        verbose=True
    )

    # Run experiment
    results = exp.run()

    # View summary
    print("\n" + exp.summary())

    # Plot comparison
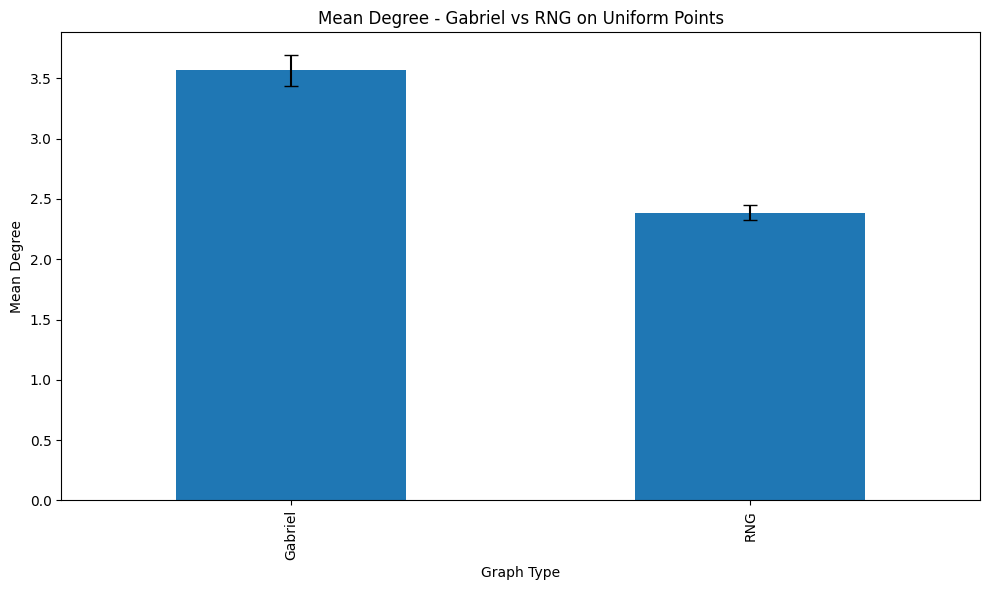
    fig, ax = exp.plot_metric('mean_degree', kind='bar')
    fig.savefig(r'tests/Experiment_figs/ex1_degree_comparison.png', dpi=150, bbox_inches='tight')

    # Compare multiple metrics
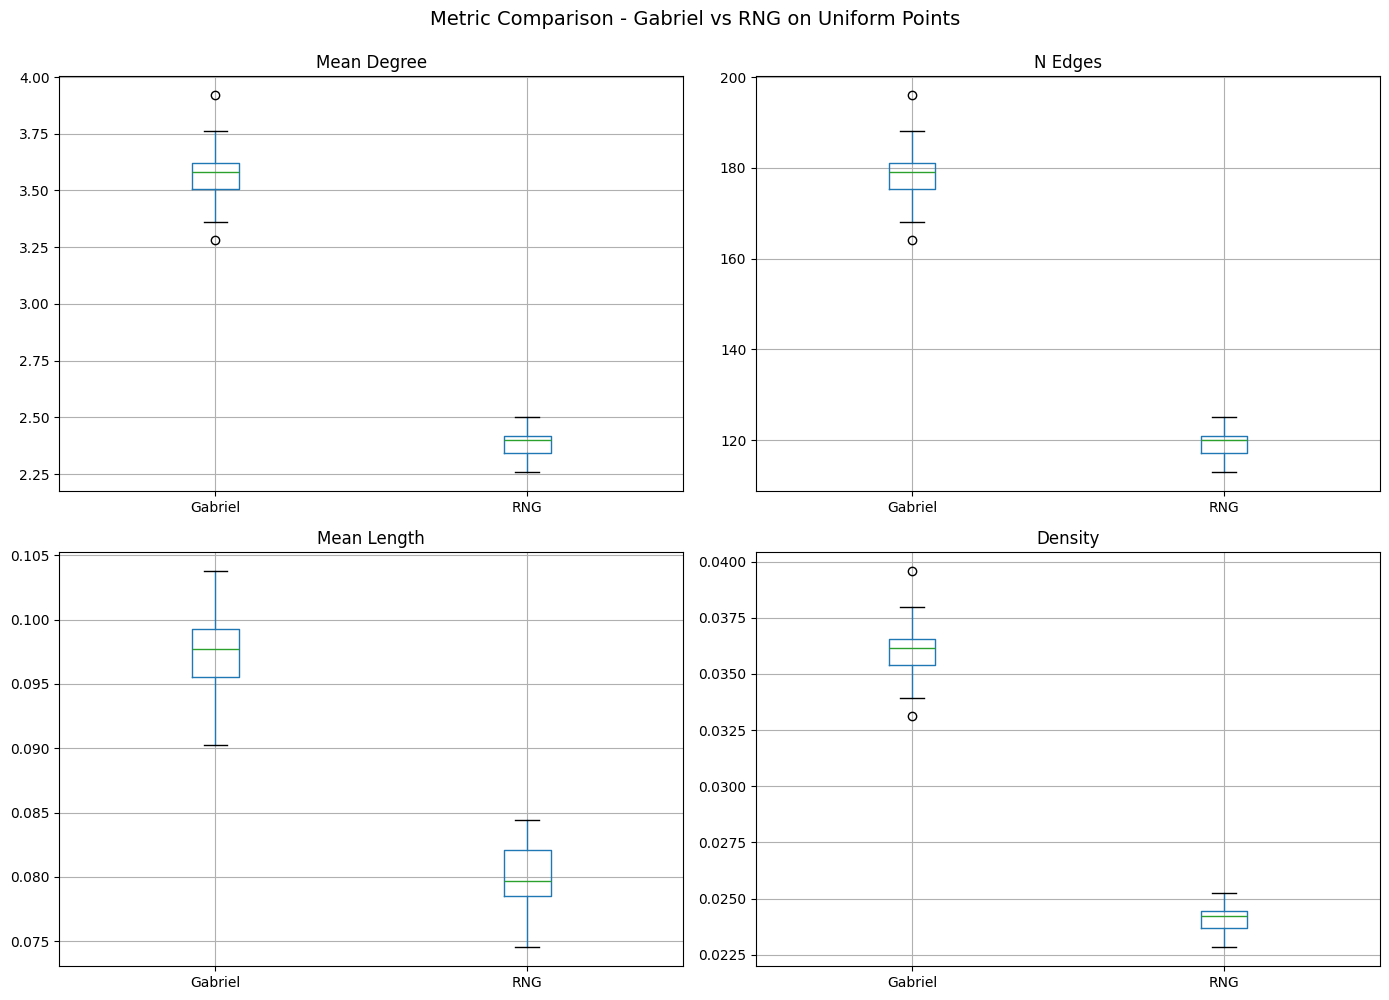
    fig, axes = exp.compare_metrics(
        metrics=['mean_degree', 'n_edges', 'mean_length', 'density']
    )
    fig.savefig(r'tests/Experiment_figs/ex1_multi_metric.png', dpi=150, bbox_inches='tight')

    # Export results
    exp.export_results(r'tests/Experimet_results/exp1_results.csv', format='csv')

    return exp
example_basic_comparison()
Running experiment: Gabriel vs RNG on Uniform Points
Simulations: 30
Graph types: 2
--------------------------------------------------
Progress: 3/30 simulations
Progress: 6/30 simulations
Progress: 9/30 simulations
Progress: 12/30 simulations
Progress: 15/30 simulations
Progress: 18/30 simulations
Progress: 21/30 simulations
Progress: 24/30 simulations
Progress: 27/30 simulations
Progress: 30/30 simulations
--------------------------------------------------
Experiment complete. 60 results collected.

Experiment: Gabriel vs RNG on Uniform Points
============================================================
Simulations: 30
Graph types: Gabriel, RNG

Aggregated Results:
------------------------------------------------------------
           n_vertices                    n_edges                      \
                 mean  std  min  max        mean       std  min  max
graph_type
Gabriel         100.0  0.0  100  100  178.366667  6.408418  164  196
RNG             100.0  0.0  100  100  119.300000  3.018906  113  125

           n_components       ... entropy_orientation           is_connected  \
                   mean  std  ...                 min       max         mean
graph_type                    ...
Gabriel             1.0  0.0  ...            4.995514  5.093594          1.0
RNG                 1.0  0.0  ...            4.813175  5.030854          1.0

                              density
            std   min   max      mean       std       min       max
graph_type
Gabriel     0.0  True  True  0.036034  0.001295  0.033131  0.039596
RNG         0.0  True  True  0.024101  0.000610  0.022828  0.025253

[2 rows x 72 columns]
Results exported to tests/Experimet_results/exp1_results.csv
Experiment('Gabriel vs RNG on Uniform Points', simulations=30, status=60 results)
EXAMPLE 2: Multiple Graph Types with Different Point Distributions#
def example_multiple_graphs():
    """Compare multiple graph types on Poisson point process."""

    exp = Experiment(
        name="Proximity Graphs on Poisson Process",
        n_simulations=40,
        seed=123
    )

    # Configure point generation
    exp.add_point_config('poissonprocess_square', intensity=50, limit=1)

    # Add multiple graph types
    exp.add_graph_config(pg.GG, name='Gabriel', closed=True)
    exp.add_graph_config(pg.RNG, name='RNG', closed=False)
    exp.add_graph_config(pg.DelaunayG, name='Delaunay')
    exp.add_graph_config(pg.MST, name='MST')
    exp.add_graph_config(pg.Beta_Skeleton, name='Beta-1.5', beta=1.5)

    # Run
    results = exp.run()

    # Aggregate and view
    agg = exp.aggregate()
    print("\nAggregated Results:")
    print(agg[['mean_degree', 'n_edges', 'n_components']])

    # Plot degree distribution
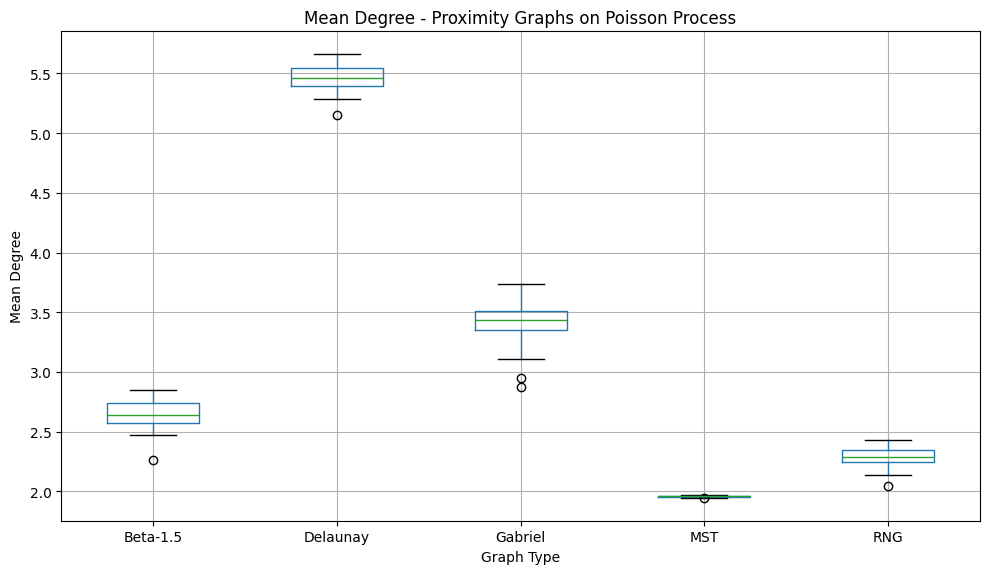
    fig, ax = exp.plot_metric('mean_degree', kind='box')
    fig.savefig(r'tests/Experiment_figs/ex2_degree_box.png', dpi=150, bbox_inches='tight')

    return exp
example_multiple_graphs()
c:\CODE\Python\app_pg\proximitygraphs\proximitygraphs\experiments.py:114: UserWarning: No point configuration provided. Use add_point_config().
  warnings.warn("No point configuration provided. Use add_point_config().")
c:\CODE\Python\app_pg\proximitygraphs\proximitygraphs\experiments.py:117: UserWarning: No graph configurations provided. Use add_graph_config().
  warnings.warn("No graph configurations provided. Use add_graph_config().")
Running experiment: Proximity Graphs on Poisson Process
Simulations: 40
Graph types: 5
--------------------------------------------------
Progress: 4/40 simulations
Progress: 8/40 simulations
Progress: 12/40 simulations
Progress: 16/40 simulations
Progress: 20/40 simulations
Progress: 24/40 simulations
Progress: 28/40 simulations
Progress: 32/40 simulations
Progress: 36/40 simulations
Progress: 40/40 simulations
--------------------------------------------------
Experiment complete. 200 results collected.

Aggregated Results:
           mean_degree                                n_edges                 \
                  mean       std       min       max     mean        std min
graph_type
Beta-1.5      2.647334  0.122023  2.260870  2.851064   64.600   9.721243  44
Delaunay      5.472951  0.107149  5.151515  5.666667  133.675  20.286901  85
Gabriel       3.412354  0.170093  2.869565  3.739130   83.225  12.445754  59
MST           1.958179  0.006064  1.939394  1.966667   47.750   6.659291  32
RNG           2.288856  0.079757  2.043478  2.425532   55.825   8.129994  39

                n_components
            max         mean  std min max
graph_type
Beta-1.5     79          1.0  0.0   1   1
Delaunay    170          1.0  0.0   1   1
Gabriel     104          1.0  0.0   1   1
MST          59          1.0  0.0   1   1
RNG          71          1.0  0.0   1   1
Experiment('Proximity Graphs on Poisson Process', simulations=40, status=200 results)
EXAMPLE 3: Custom Metrics#
def example_custom_metrics():

    # Define custom metrics
    def edge_length_variance(graph):
        """Variance of edge lengths."""
        if graph.m == 0:
            return 0.0
        return float(np.var(graph.lengths))

    def connectivity_ratio(graph):
        """Ratio of largest component size to total vertices."""
        if graph.n == 0:
            return 0.0
        components = graph.graph.connected_components()
        if not components:
            return 0.0
        largest = max(len(c) for c in components)
        return largest / graph.n

    def diameter(graph):
        """Graph diameter (longest shortest path)."""
        try:
            if graph.cc == 1:  # Only for connected graphs
                return float(graph.graph.diameter(directed=False))
            else:
                return np.inf
        except:
            return np.inf

    def avg_clustering(graph):
        """Average clustering coefficient."""
        try:
            return float(graph.graph.transitivity_undirected())
        except:
            return 0.0

    # Create experiment
    exp = Experiment(
        name="Custom Metrics Example",
        point_config={
            'method': 'normal_dist',
            'params': {'n': 80}
        },
        graph_configs=[
            {'class': pg.GG, 'name': 'Gabriel'},
            {'class': pg.DelaunayG, 'name': 'Delaunay'}
        ],
        n_simulations=25,
        seed=999
    )

    # Register custom metrics
    exp.add_custom_metric('length_variance', edge_length_variance)
    exp.add_custom_metric('connectivity_ratio', connectivity_ratio)
    exp.add_custom_metric('diameter', diameter)
    exp.add_custom_metric('clustering', avg_clustering)

    # Run
    results = exp.run()

    # View custom metrics
    print("\nCustom Metrics Summary:")
    custom_cols = ['length_variance', 'connectivity_ratio', 'diameter', 'clustering']
    print(results.groupby('graph_type')[custom_cols].mean())

    # Plot custom metric
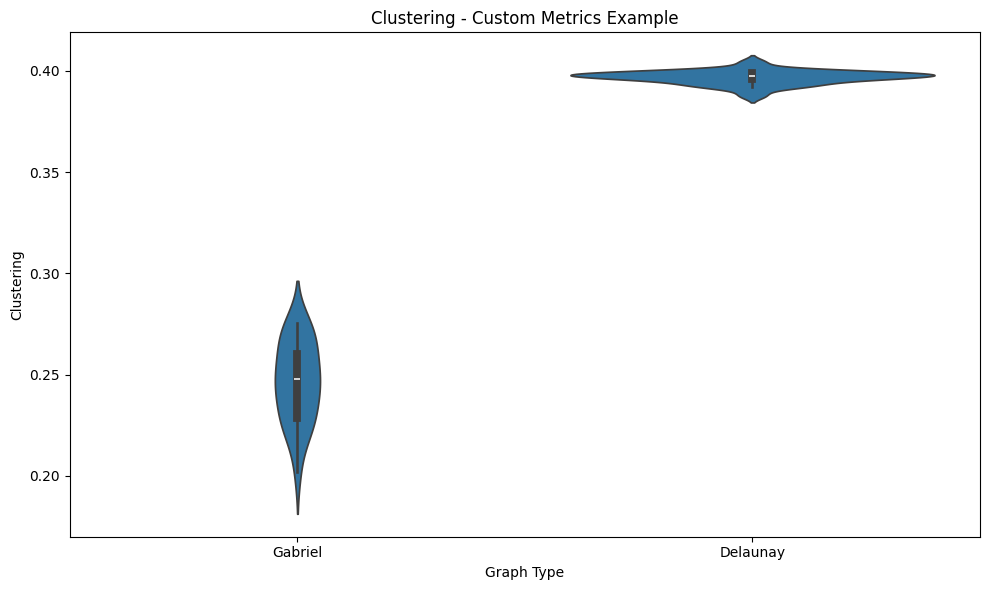
    fig, ax = exp.plot_metric('clustering', kind='violin')
    fig.savefig(r'tests/Experiment_figs/ex3_clustering.png', dpi=150, bbox_inches='tight')

    return exp
example_custom_metrics()
Running experiment: Custom Metrics Example
Simulations: 25
Graph types: 2
--------------------------------------------------
Progress: 2/25 simulations
Progress: 4/25 simulations
Progress: 6/25 simulations
Progress: 8/25 simulations
Progress: 10/25 simulations
Progress: 12/25 simulations
Progress: 14/25 simulations
Progress: 16/25 simulations
Progress: 18/25 simulations
Progress: 20/25 simulations
Progress: 22/25 simulations
Progress: 24/25 simulations
--------------------------------------------------
Experiment complete. 50 results collected.

Custom Metrics Summary:
            length_variance  connectivity_ratio  diameter  clustering
graph_type
Delaunay           0.218744                 1.0      7.32    0.396866
Gabriel            0.080126                 1.0     12.48    0.246166
Experiment('Custom Metrics Example', simulations=25, status=50 results)
EXAMPLE 4: Biological Graphs - Physarum#
def example_biological_graphs():

    exp = Experiment(
        name="Physarum vs Traditional Graphs",
        point_config={
            'method': 'uniform_square',
            'params': {'n': 50}
        },
        n_simulations=15,
        seed=777,
        verbose=True
    )

    # Add traditional graphs
    exp.add_graph_config(pg.GG, name='Gabriel')
    exp.add_graph_config(pg.MST, name='MST')

    # Add Physarum with different configurations
    exp.add_graph_config(
        pg.PhysarumGraph,
        name='Physarum-Short',
        sources=[0],
        sinks=[49],
        steps=100,
        gamma=1.5,
        base_graph='delaunay'
    )

    exp.add_graph_config(
        pg.PhysarumGraph,
        name='Physarum-Long',
        sources=[0],
        sinks=[49],
        steps=300,
        gamma=2.0,
        base_graph='delaunay'
    )

    # Run
    results = exp.run()

    # Compare edge counts
    print("\nEdge Count Comparison:")
    print(results.groupby('graph_type')['n_edges'].describe())

    # Plot comparison
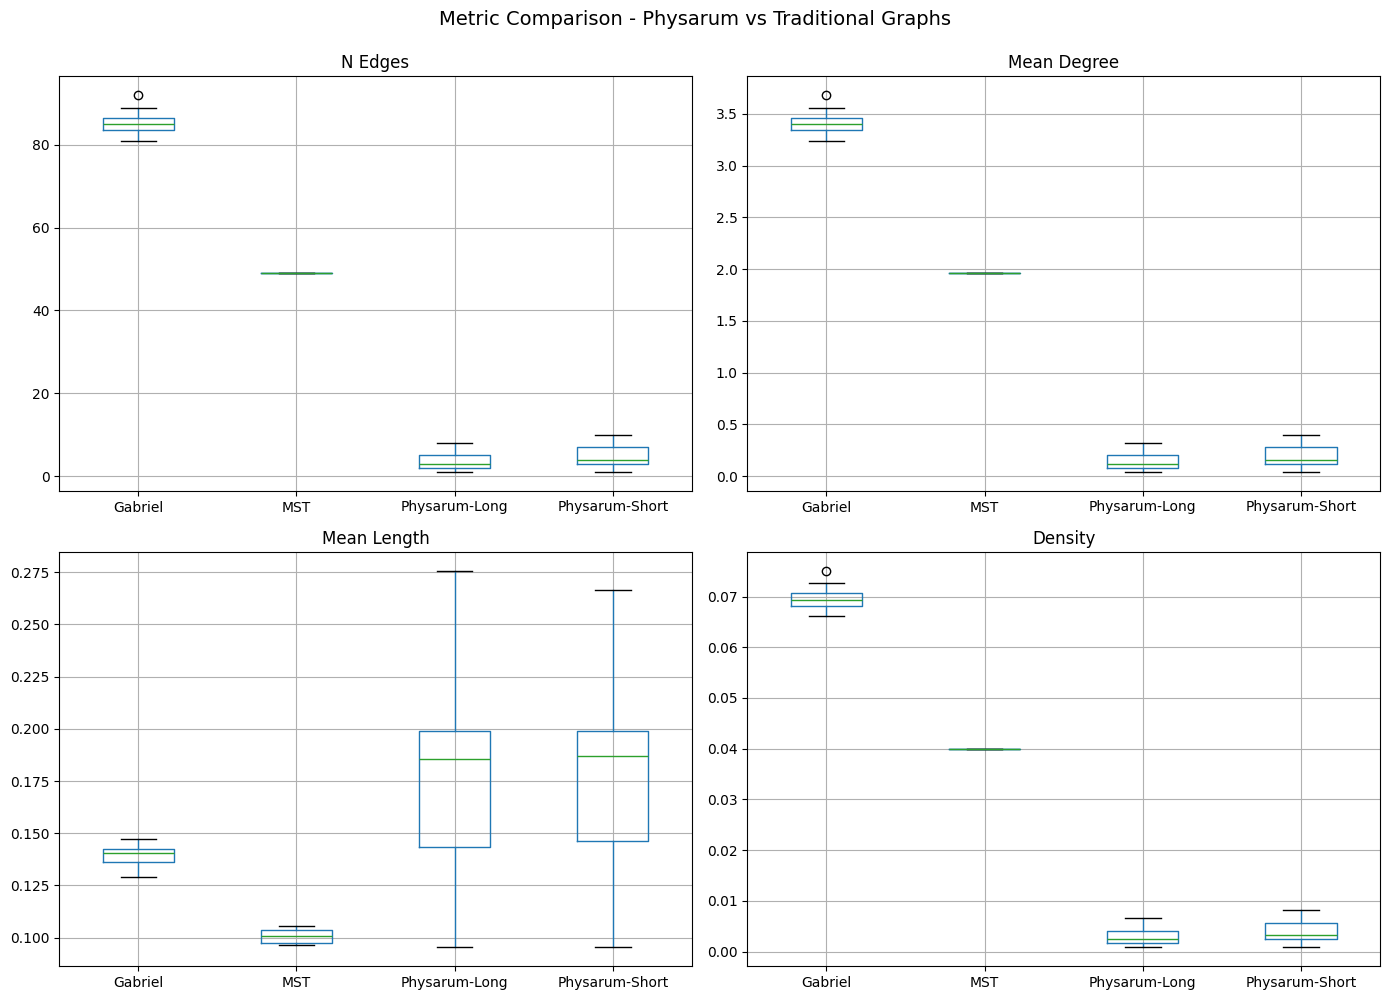
    fig, axes = exp.compare_metrics(['n_edges', 'mean_degree', 'mean_length', 'density'])
    fig.savefig(r'tests/Experiment_figs/ex4_physarum.png', dpi=150, bbox_inches='tight')

    return exp
example_biological_graphs()
c:\CODE\Python\app_pg\proximitygraphs\proximitygraphs\experiments.py:117: UserWarning: No graph configurations provided. Use add_graph_config().
  warnings.warn("No graph configurations provided. Use add_graph_config().")
Running experiment: Physarum vs Traditional Graphs
Simulations: 15
Graph types: 4
--------------------------------------------------
Progress: 1/15 simulations
Progress: 2/15 simulations
Progress: 3/15 simulations
Progress: 4/15 simulations
Progress: 5/15 simulations
Progress: 6/15 simulations
Progress: 7/15 simulations
Progress: 8/15 simulations
Progress: 9/15 simulations
Progress: 10/15 simulations
Progress: 11/15 simulations
Progress: 12/15 simulations
Progress: 13/15 simulations
Progress: 14/15 simulations
Progress: 15/15 simulations
--------------------------------------------------
Experiment complete. 60 results collected.

Edge Count Comparison:
                count       mean       std   min   25%   50%   75%   max
graph_type
Gabriel          15.0  85.066667  3.011091  81.0  83.5  85.0  86.5  92.0
MST              15.0  49.000000  0.000000  49.0  49.0  49.0  49.0  49.0
Physarum-Long    15.0   3.466667  2.133631   1.0   2.0   3.0   5.0   8.0
Physarum-Short   15.0   4.533333  2.695676   1.0   3.0   4.0   7.0  10.0
Experiment('Physarum vs Traditional Graphs', simulations=15, status=60 results)
EXAMPLE 5: Parameter Sweep#
def example_parameter_sweep():

    beta_values = [0.5, 1.0, 1.5, 2.0, 2.5, 3.0]

    exp = Experiment(
        name="Beta-Skeleton Parameter Sweep",
        point_config={
            'method': 'uniform_square',
            'params': {'n': 100}
        },
        n_simulations=20,
        seed=2024
    )

    # Add configuration for each beta value
    for beta in beta_values:
        exp.add_graph_config(
            pg.Beta_Skeleton,
            name=f'Beta-{beta}',
            beta=beta,
            type_region='lune' if beta >= 1 else 'intersection'
        )

    # Run
    results = exp.run()

    # Plot evolution of metrics vs beta
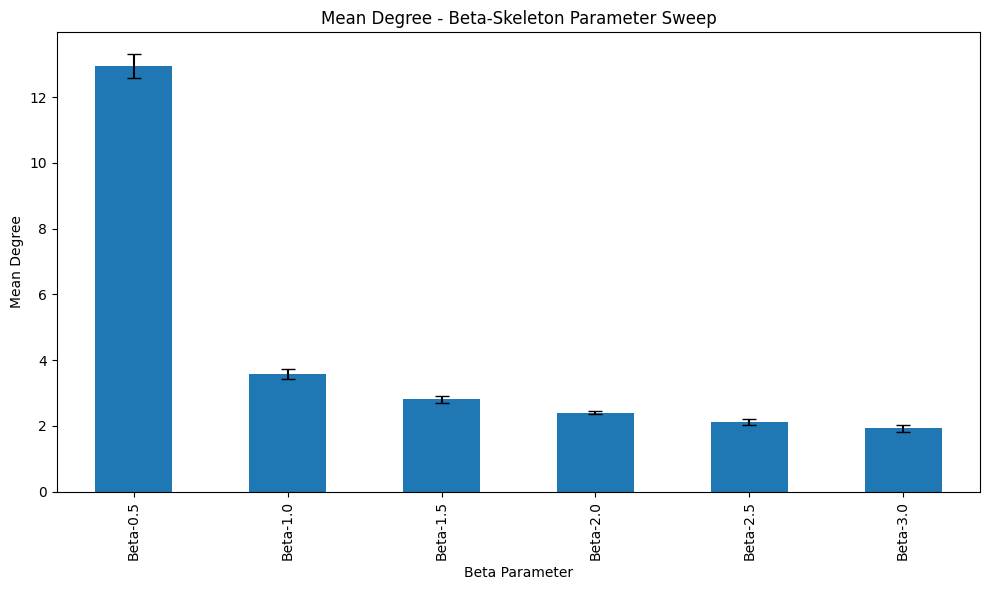
    fig, ax = exp.plot_metric('mean_degree', kind='bar')
    ax.set_xlabel('Beta Parameter')
    fig.savefig(r'tests/Experiment_figs/ex5_beta_sweep.png', dpi=150, bbox_inches='tight')

    # Export detailed results
    exp.export_results(r'tests/Experimet_results/ex5_sweep_results.csv')

    return exp
example_parameter_sweep()
c:\CODE\Python\app_pg\proximitygraphs\proximitygraphs\experiments.py:117: UserWarning: No graph configurations provided. Use add_graph_config().
  warnings.warn("No graph configurations provided. Use add_graph_config().")
Running experiment: Beta-Skeleton Parameter Sweep
Simulations: 20
Graph types: 6
--------------------------------------------------
Progress: 2/20 simulations
Progress: 4/20 simulations
Progress: 6/20 simulations
Progress: 8/20 simulations
Progress: 10/20 simulations
Progress: 12/20 simulations
Progress: 14/20 simulations
Progress: 16/20 simulations
Progress: 18/20 simulations
Progress: 20/20 simulations
--------------------------------------------------
Experiment complete. 120 results collected.
Results exported to tests/Experimet_results/ex5_sweep_results.csv
Experiment('Beta-Skeleton Parameter Sweep', simulations=20, status=120 results)
EXAMPLE 6: Different Point Distributions#
def example_point_distributions():

    distributions = [
        {'method': 'uniform_square', 'params': {'n': 100}, 'label': 'Uniform'},
        {'method': 'normal_dist', 'params': {'n': 100}, 'label': 'Normal'},
        {'method': 'uniform_sphere', 'params': {'n': 100}, 'label': 'Circle'},
        {'method': 'poissonprocess_square', 'params': {'intensity': 100, 'limit': 1}, 'label': 'Poisson'},
    ]

    all_results = []

    for dist_config in distributions:
        exp = Experiment(
            name=f"GG on {dist_config['label']} Points",
            point_config={
                'method': dist_config['method'],
                'params': dist_config['params']
            },
            graph_configs=[
                {'class': pg.GG, 'params': {'closed': True}, 'name': dist_config['label']}
            ],
            n_simulations=30,
            seed=456,
            verbose=False
        )

        results = exp.run()
        all_results.append(results)

    # Combine results
    import pandas as pd
    combined = pd.concat(all_results, ignore_index=True)

    # Compare
    print("\nMean Degree by Distribution:")
    print(combined.groupby('graph_type')['mean_degree'].agg(['mean', 'std']))

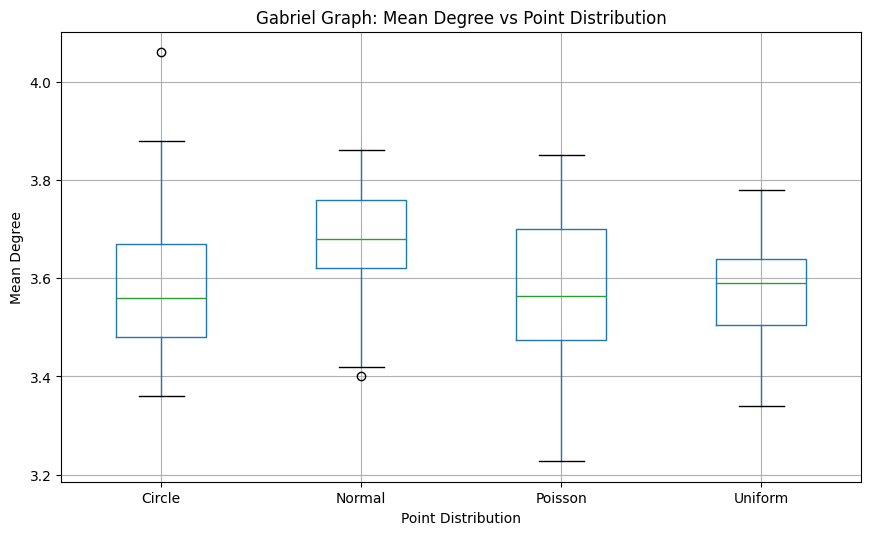
    # Box plot comparison
    import matplotlib.pyplot as plt
    fig, ax = plt.subplots(figsize=(10, 6))
    combined.boxplot(column='mean_degree', by='graph_type', ax=ax)
    ax.set_title('Gabriel Graph: Mean Degree vs Point Distribution')
    ax.set_xlabel('Point Distribution')
    ax.set_ylabel('Mean Degree')
    plt.suptitle('')
    fig.savefig(r'tests/Experiment_figs/ex6_distributions.png', dpi=150, bbox_inches='tight')

    return combined
example_point_distributions()
Mean Degree by Distribution:
                mean       std
graph_type
Circle      3.584667  0.155868
Normal      3.666667  0.123772
Poisson     3.578090  0.154244
Uniform     3.576000  0.107946
| simulation | graph_type | n_vertices | n_edges | n_components | n_faces | mean_degree | std_degree | min_degree | max_degree | mean_length | std_length | min_length | max_length | total_length | entropy_degree | entropy_length | entropy_orientation | is_connected | density | |
|---|---|---|---|---|---|---|---|---|---|---|---|---|---|---|---|---|---|---|---|---|
| 0 | 0 | Uniform | 100 | 180 | 1 | 82 | 3.600000 | 1.122497 | 1 | 7 | 0.103558 | 0.054893 | 0.010018 | 0.269467 | 18.640502 | 2.182623 | 2.933179 | 5.054970 | True | 0.036364 |
| 1 | 1 | Uniform | 100 | 174 | 1 | 76 | 3.480000 | 1.034215 | 2 | 7 | 0.101673 | 0.057750 | 0.013404 | 0.269784 | 17.691135 | 2.029190 | 2.998427 | 4.980369 | True | 0.035152 |
| 2 | 2 | Uniform | 100 | 184 | 1 | 86 | 3.680000 | 1.047664 | 2 | 6 | 0.098360 | 0.048865 | 0.009550 | 0.266757 | 18.098178 | 2.075242 | 2.879066 | 4.992177 | True | 0.037172 |
| 3 | 3 | Uniform | 100 | 182 | 1 | 84 | 3.640000 | 1.135958 | 1 | 7 | 0.101513 | 0.049690 | 0.001688 | 0.253578 | 18.475379 | 2.208059 | 2.929203 | 5.021635 | True | 0.036768 |
| 4 | 4 | Uniform | 100 | 180 | 1 | 82 | 3.600000 | 1.086278 | 2 | 7 | 0.100016 | 0.056480 | 0.005329 | 0.251532 | 18.002902 | 2.104521 | 3.074982 | 5.088642 | True | 0.036364 |
| ... | ... | ... | ... | ... | ... | ... | ... | ... | ... | ... | ... | ... | ... | ... | ... | ... | ... | ... | ... | ... |
| 115 | 25 | Poisson | 95 | 164 | 1 | 71 | 3.452632 | 0.867767 | 2 | 6 | 0.098043 | 0.052001 | 0.008272 | 0.254441 | 16.079080 | 1.801304 | 2.981587 | 5.023933 | True | 0.036730 |
| 116 | 26 | Poisson | 127 | 233 | 1 | 108 | 3.669291 | 1.164130 | 1 | 6 | 0.083562 | 0.043997 | 0.004338 | 0.330205 | 19.469950 | 2.223303 | 2.303980 | 5.122950 | True | 0.029121 |
| 117 | 27 | Poisson | 118 | 223 | 1 | 107 | 3.779661 | 1.090293 | 2 | 6 | 0.091801 | 0.046759 | 0.003343 | 0.248279 | 20.471545 | 2.123032 | 2.818766 | 5.071520 | True | 0.032305 |
| 118 | 28 | Poisson | 105 | 170 | 1 | 67 | 3.238095 | 0.899987 | 1 | 6 | 0.088020 | 0.050135 | 0.003906 | 0.270428 | 14.963362 | 1.856751 | 2.846273 | 5.029204 | True | 0.031136 |
| 119 | 29 | Poisson | 89 | 153 | 1 | 66 | 3.438202 | 1.027215 | 1 | 6 | 0.099878 | 0.057457 | 0.014855 | 0.323891 | 15.281344 | 2.059013 | 2.729309 | 4.948807 | True | 0.039070 |
120 rows × 20 columns
EXAMPLE 7: Storing and Retrieving Graphs#
Axes compose no funciona
def example_graph_storage():

    exp = Experiment(
        name="Store Graphs Example",
        point_config={
            'method': 'uniform_square',
            'params': {'n': 50}
        },
        graph_configs=[
            {'class': pg.GG, 'name': 'Gabriel'},
            {'class': pg.RNG, 'name': 'RNG'}
        ],
        n_simulations=5,
        seed=111
    )

    # Run with graph storage enabled
    results = exp.run(store_graphs=True)

    # Retrieve specific graphs
    gabriel_0 = exp.get_graph(simulation=0, graph_type='Gabriel')
    rng_0 = exp.get_graph(simulation=0, graph_type='RNG')

    if gabriel_0 and rng_0:
        # Visualize
        import matplotlib.pyplot as plt
        fig, axes = plt.subplots(1, 2, figsize=(14, 6))

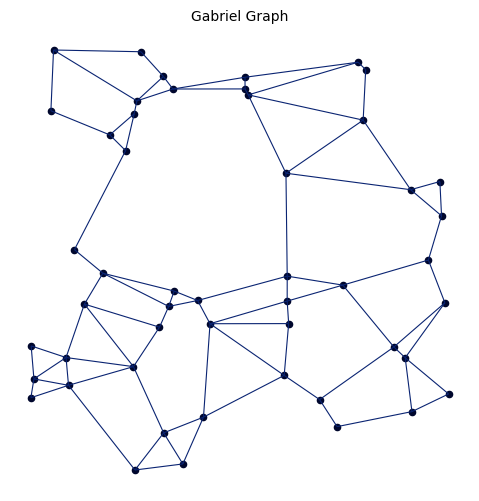
        gabriel_0.draw(
            figsize=(7, 6),
            v_size=20,
            e_size=0.8,
            title=True,
            axis=False,
            save=None
        )
        plt.sca(axes[0])

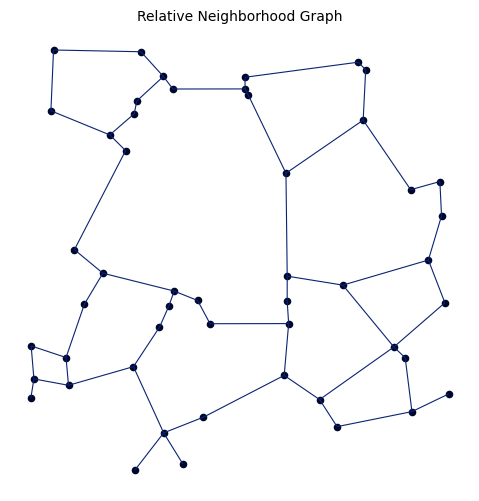
        rng_0.draw(
            figsize=(7, 6),
            v_size=20,
            e_size=0.8,
            title=True,
            axis=False,
            save=None
        )
        plt.sca(axes[1])

        #fig.savefig(r'tests/Experiment_figs/ex7_stored_graphs.png', dpi=150, bbox_inches='tight')

    return exp
example_graph_storage()
Running experiment: Store Graphs Example
Simulations: 5
Graph types: 2
--------------------------------------------------
Progress: 1/5 simulations
Progress: 2/5 simulations
Progress: 3/5 simulations
Progress: 4/5 simulations
Progress: 5/5 simulations
--------------------------------------------------
Experiment complete. 10 results collected.
Experiment('Store Graphs Example', simulations=5, status=10 results)
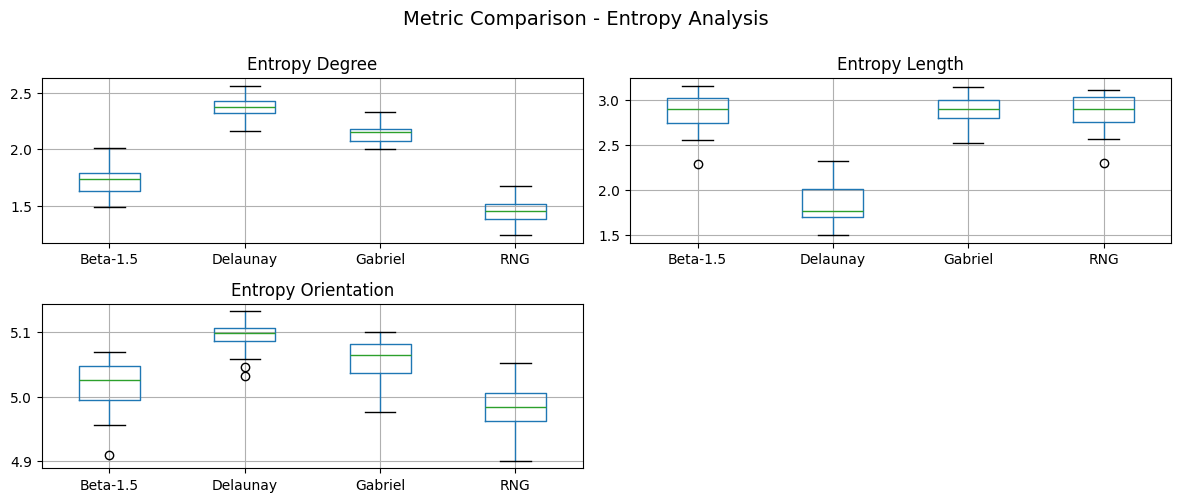
EXAMPLE 8: Advanced - Entropy Analysis#
def example_entropy_analysis():
    """Analyze entropy metrics across graph types."""

    exp = Experiment(
        name="Entropy Analysis",
        point_config={
            'method': 'uniform_square',
            'params': {'n': 120}
        },
        graph_configs=[
            {'class': pg.GG, 'name': 'Gabriel'},
            {'class': pg.RNG, 'name': 'RNG'},
            {'class': pg.DelaunayG, 'name': 'Delaunay'},
            {'class': pg.Beta_Skeleton, 'name': 'Beta-1.5', 'params': {'beta': 1.5}}
        ],
        n_simulations=40,
        seed=888
    )

    # Run
    results = exp.run()

    # Focus on entropy metrics
    entropy_metrics = ['entropy_degree', 'entropy_length', 'entropy_orientation']

    print("\nEntropy Metrics Summary:")
    print(results.groupby('graph_type')[entropy_metrics].mean())

    # Visualize
    fig, axes = exp.compare_metrics(entropy_metrics, figsize=(12, 5))
    fig.savefig(r'tests/Experiment_figs/ex8_entropy.png', dpi=150, bbox_inches='tight')

    return exp
example_entropy_analysis()
Running experiment: Entropy Analysis
Simulations: 40
Graph types: 4
--------------------------------------------------
Progress: 4/40 simulations
Progress: 8/40 simulations
Progress: 12/40 simulations
Progress: 16/40 simulations
Progress: 20/40 simulations
Progress: 24/40 simulations
Progress: 28/40 simulations
Progress: 32/40 simulations
Progress: 36/40 simulations
Progress: 40/40 simulations
--------------------------------------------------
Experiment complete. 160 results collected.

Entropy Metrics Summary:
            entropy_degree  entropy_length  entropy_orientation
graph_type
Beta-1.5          1.733967        2.889976             5.019147
Delaunay          2.369917        1.856518             5.095932
Gabriel           2.139513        2.902197             5.056555
RNG               1.453369        2.884252             4.983676
Experiment('Entropy Analysis', simulations=40, status=160 results)
EXAMPLE 9: Point Transformations#
def example_point_transformations():
    """Demonstrate point transformations in experiments."""

    # Example 1: Rotation
    exp1 = Experiment(
        name="Gabriel on Rotated Grid",
        point_config={
            'method': 'uniform_square',
            'params': {'n': 100},
            'transformations': [
                {'method': 'rotation', 'params': {'angle': 45, 'degree': True}}
            ]
        },
        graph_configs=[
            {'class': pg.GG, 'name': 'Gabriel'}
        ],
        n_simulations=10,
        seed=111
    )

    results1 = exp1.run(store_graphs=True)

    # Visualize one rotated graph
    g = exp1.get_graph(0, 'Gabriel')
    if g:
        fig, ax = g.draw(figsize=(8, 8), title=True)
        fig.savefig(r'tests/Experiment_figs/ex9_rotated_grid.png', dpi=150, bbox_inches='tight')

    # Example 2: Multiple transformations
    exp2 = Experiment(
        name="Transformed Uniform Points",
        n_simulations=20,
        seed=222
    )

    exp2.add_point_config(
        'uniform_square',
        n=100,
        transformations=[
            {'method': 'rotation', 'params': {'angle': 30}},
            {'method': 'scaling', 'params': {'scale': 2.0}},
            {'method': 'traslation', 'params': {'c': [0.5, 0.5]}}
        ]
    )

    exp2.add_graph_config(pg.GG, name='Gabriel')
    exp2.add_graph_config(pg.RNG, name='RNG')

    results2 = exp2.run()
    print("\nResults with multiple transformations:")
    print(results2.groupby('graph_type')[['mean_degree', 'n_edges']].mean())

    # Example 3: Perturbation (useful for robustness testing)
    exp3 = Experiment(
        name="Grid with Perturbation",
        n_simulations=25,
        seed=333
    )

    exp3.add_point_config(
        'uniform_square',
        n=144,
        transformations=[
            {'method': 'perturb', 'params': {'radius': 0.1}}
        ]
    )

    exp3.add_graph_config(pg.GG, name='Gabriel')
    exp3.add_graph_config(pg.DelaunayG, name='Delaunay')

    results3 = exp3.run()

    # Compare with and without perturbation
    fig, ax = exp3.plot_metric('mean_degree', kind='box')
    ax.set_title('Effect of Perturbation on Grid Graphs')
    fig.savefig(r'tests/Experiment_figs/ex9_perturbation.png', dpi=150, bbox_inches='tight')

    return exp1, exp2, exp3
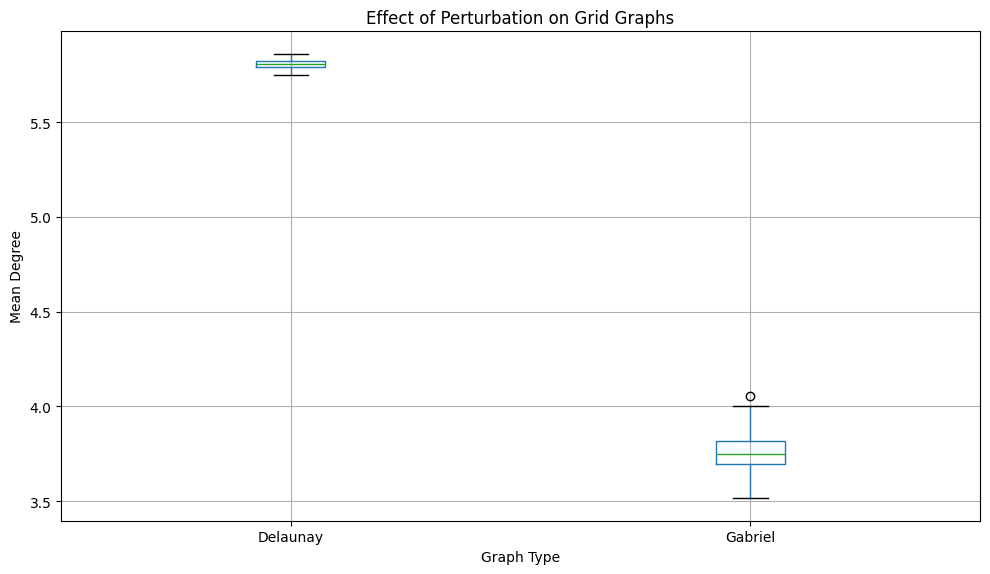
example_point_transformations()
Running experiment: Gabriel on Rotated Grid
Simulations: 10
Graph types: 1
--------------------------------------------------
Progress: 1/10 simulations
Progress: 2/10 simulations
Progress: 3/10 simulations
Progress: 4/10 simulations
Progress: 5/10 simulations
Progress: 6/10 simulations
Progress: 7/10 simulations
Progress: 8/10 simulations
Progress: 9/10 simulations
Progress: 10/10 simulations
--------------------------------------------------
Experiment complete. 10 results collected.
Running experiment: Transformed Uniform Points
Simulations: 20
Graph types: 2
--------------------------------------------------
Progress: 2/20 simulations
Progress: 4/20 simulations
c:\CODE\Python\app_pg\proximitygraphs\proximitygraphs\experiments.py:114: UserWarning: No point configuration provided. Use add_point_config().
  warnings.warn("No point configuration provided. Use add_point_config().")
c:\CODE\Python\app_pg\proximitygraphs\proximitygraphs\experiments.py:117: UserWarning: No graph configurations provided. Use add_graph_config().
  warnings.warn("No graph configurations provided. Use add_graph_config().")
Progress: 6/20 simulations
Progress: 8/20 simulations
Progress: 10/20 simulations
Progress: 12/20 simulations
Progress: 14/20 simulations
Progress: 16/20 simulations
Progress: 18/20 simulations
Progress: 20/20 simulations
--------------------------------------------------
Experiment complete. 40 results collected.

Results with multiple transformations:
            mean_degree  n_edges
graph_type
Gabriel           3.556    177.8
RNG               2.378    118.9
Running experiment: Grid with Perturbation
Simulations: 25
Graph types: 2
--------------------------------------------------
Progress: 2/25 simulations
Progress: 4/25 simulations
Progress: 6/25 simulations
Progress: 8/25 simulations
Progress: 10/25 simulations
Progress: 12/25 simulations
Progress: 14/25 simulations
Progress: 16/25 simulations
c:\CODE\Python\app_pg\proximitygraphs\proximitygraphs\experiments.py:114: UserWarning: No point configuration provided. Use add_point_config().
  warnings.warn("No point configuration provided. Use add_point_config().")
c:\CODE\Python\app_pg\proximitygraphs\proximitygraphs\experiments.py:117: UserWarning: No graph configurations provided. Use add_graph_config().
  warnings.warn("No graph configurations provided. Use add_graph_config().")
Progress: 18/25 simulations
Progress: 20/25 simulations
Progress: 22/25 simulations
Progress: 24/25 simulations
--------------------------------------------------
Experiment complete. 50 results collected.
(Experiment('Gabriel on Rotated Grid', simulations=10, status=10 results),
 Experiment('Transformed Uniform Points', simulations=20, status=40 results),
 Experiment('Grid with Perturbation', simulations=25, status=50 results))