Plotting with method draw_grid#
Se crea un nuevo metodo para plottear un grid de graficas
import time
import numpy as np
import matplotlib.pyplot as plt
import proximitygraphs as pg
uniform_sphere = pg.SetPoints.uniform_sphere(n=1000, seed=0)
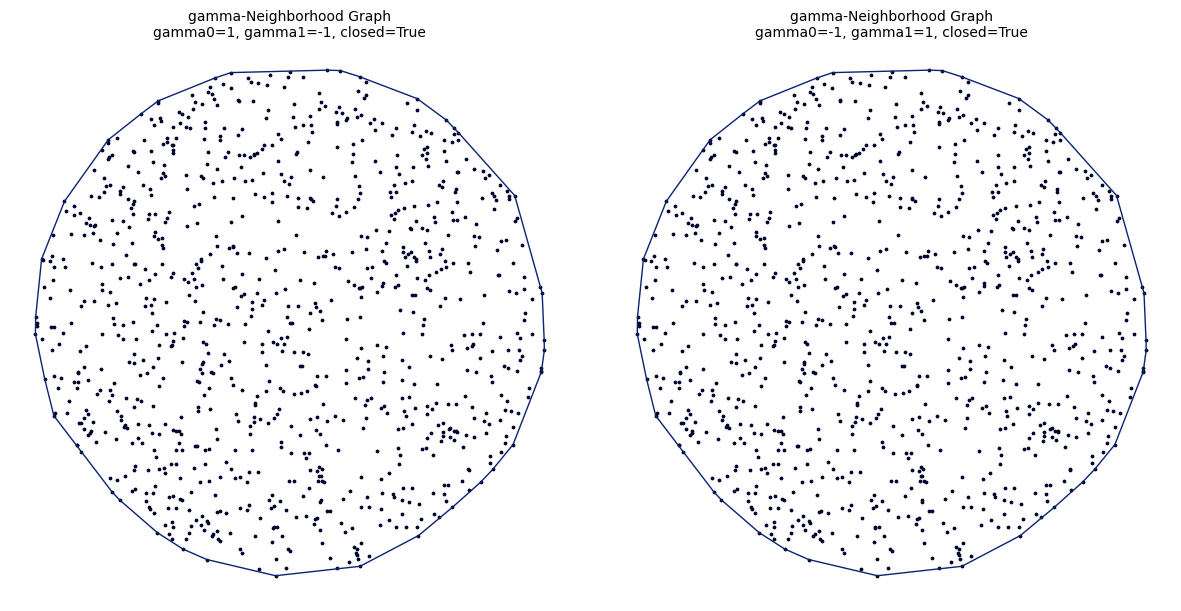
H1 = pg.Gamma_Graph(uniform_sphere, gamma0=1, gamma1=-1, closed=True, block_size=128)
H2 = pg.Gamma_Graph(uniform_sphere, gamma0=-1, gamma1=1, closed=True, block_size=128)

pg.draw_grid([H1, H2], 1, 2, figsize=(12, 6), details=True)
(<Figure size 1200x600 with 2 Axes>,
 array([<Axes: title={'center': 'gamma-Neighborhood Graph\ngamma0=1, gamma1=-1, closed=True'}>,
        <Axes: title={'center': 'gamma-Neighborhood Graph\ngamma0=-1, gamma1=1, closed=True'}>],
       dtype=object))
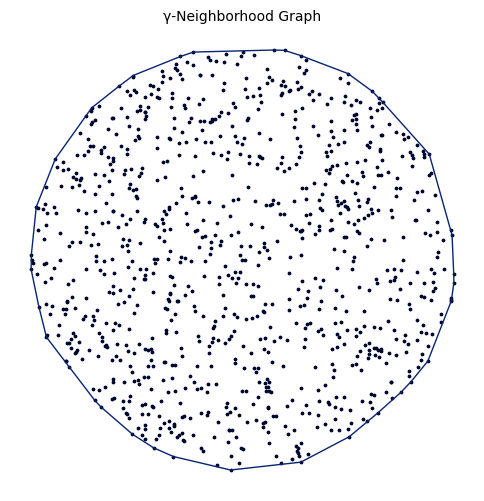
H1.draw()
(<Figure size 600x600 with 1 Axes>,
 <Axes: title={'center': 'gamma-Neighborhood Graph'}>)
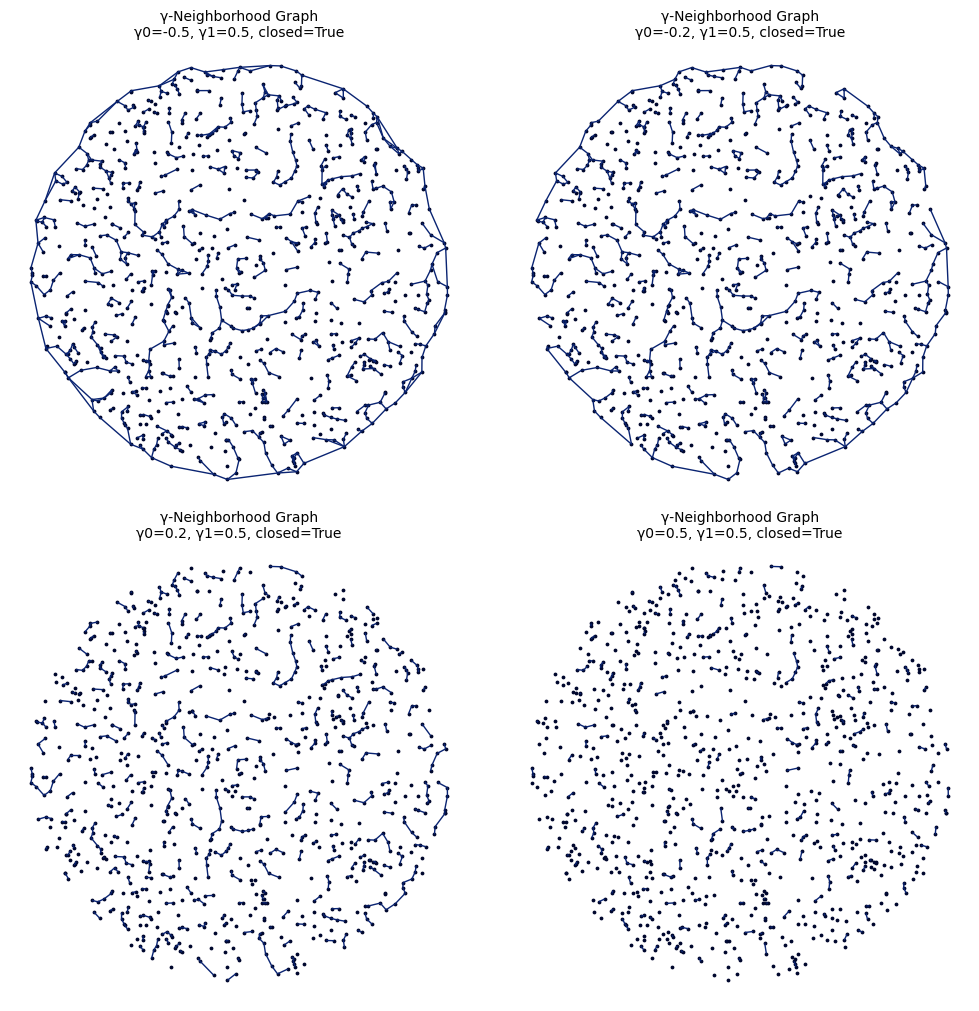
H3 = pg.Gamma_Graph(uniform_sphere, gamma0=-0.5, gamma1=0.5, closed=True, block_size=128),
H4 = pg.Gamma_Graph(uniform_sphere, gamma0=-0.2, gamma1=0.5, closed=True, block_size=128),
H5 = pg.Gamma_Graph(uniform_sphere, gamma0=0.2, gamma1=0.5, closed=True, block_size=128),
H6 = pg.Gamma_Graph(uniform_sphere, gamma0=0.5, gamma1=0.5, closed=True, block_size=128),

graphs = [H3, H4, H5, H6]

pg.draw_grid(graphs, 2, 2, figsize=(10, 10), details=True)
(<Figure size 1000x1000 with 4 Axes>,
 array([[<Axes: title={'center': 'gamma-Neighborhood Graph\ngamma0=-0.5, gamma1=0.5, closed=True'}>,
         <Axes: title={'center': 'gamma-Neighborhood Graph\ngamma0=-0.2, gamma1=0.5, closed=True'}>],
        [<Axes: title={'center': 'gamma-Neighborhood Graph\ngamma0=0.2, gamma1=0.5, closed=True'}>,
         <Axes: title={'center': 'gamma-Neighborhood Graph\ngamma0=0.5, gamma1=0.5, closed=True'}>]],
       dtype=object))
No method#
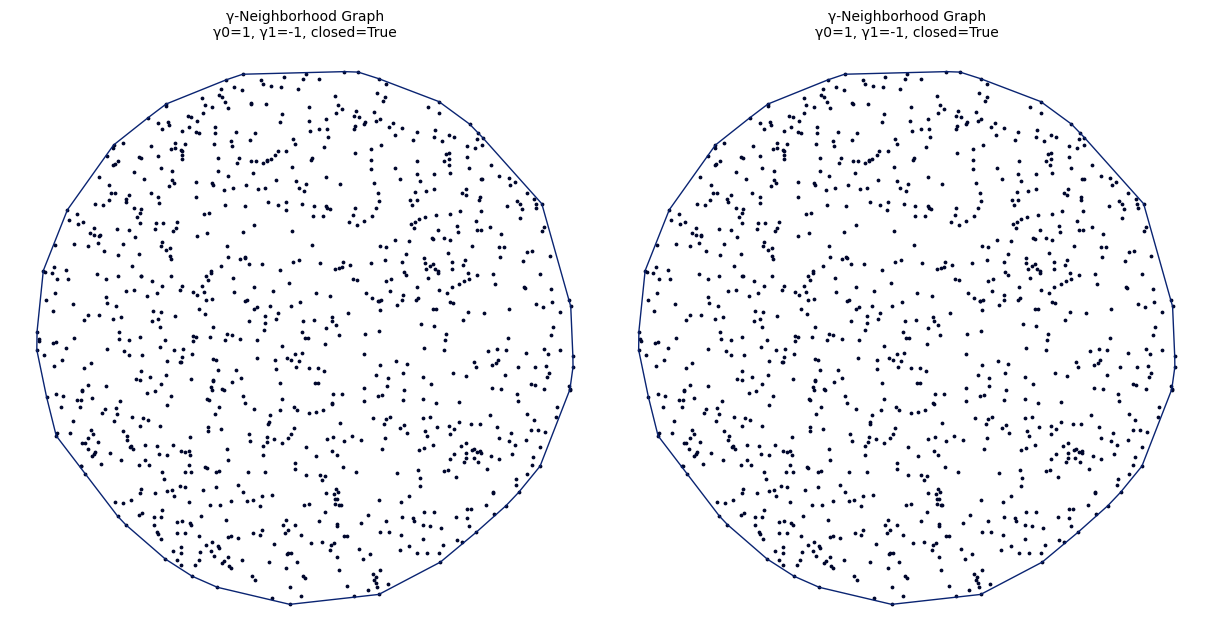
fig, axs = plt.subplots(1, 2, figsize=(12, 12), constrained_layout=True)
gammas = [(1, -1), (1, -1)]

for ax, (gamma0, gamma1) in zip(axs, gammas):

    H = pg.Gamma_Graph(uniform_sphere, gamma0=gamma0, gamma1=gamma1, closed=True, block_size=128)
    H.draw(ax=ax, details=True)

plt.show()
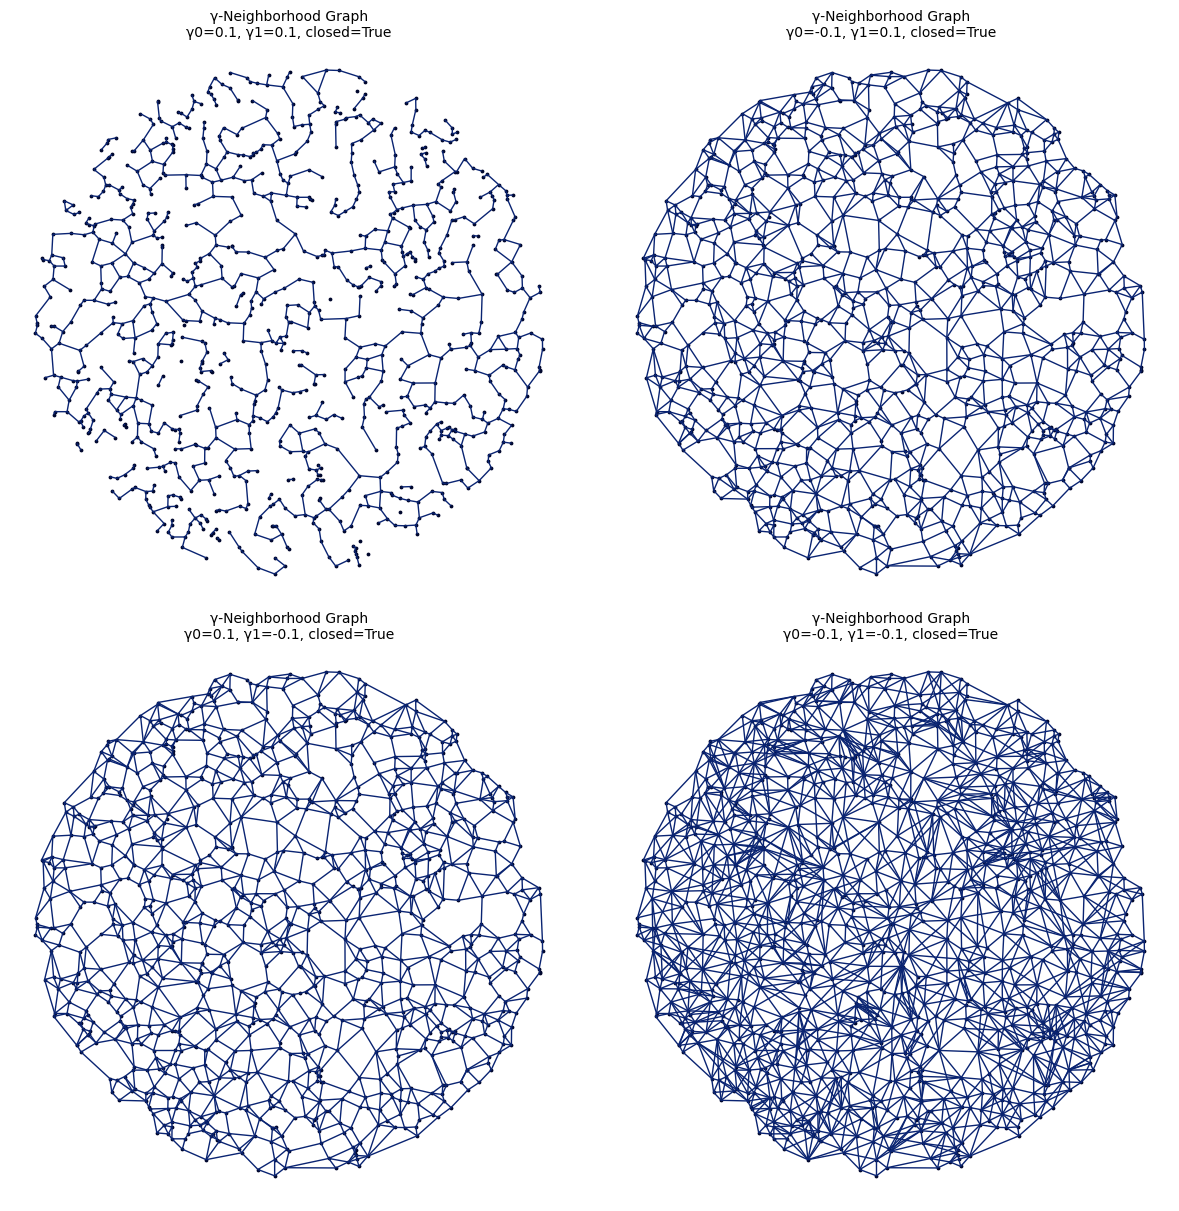
fig, axs = plt.subplots(2, 2, figsize=(12, 12), constrained_layout=True)
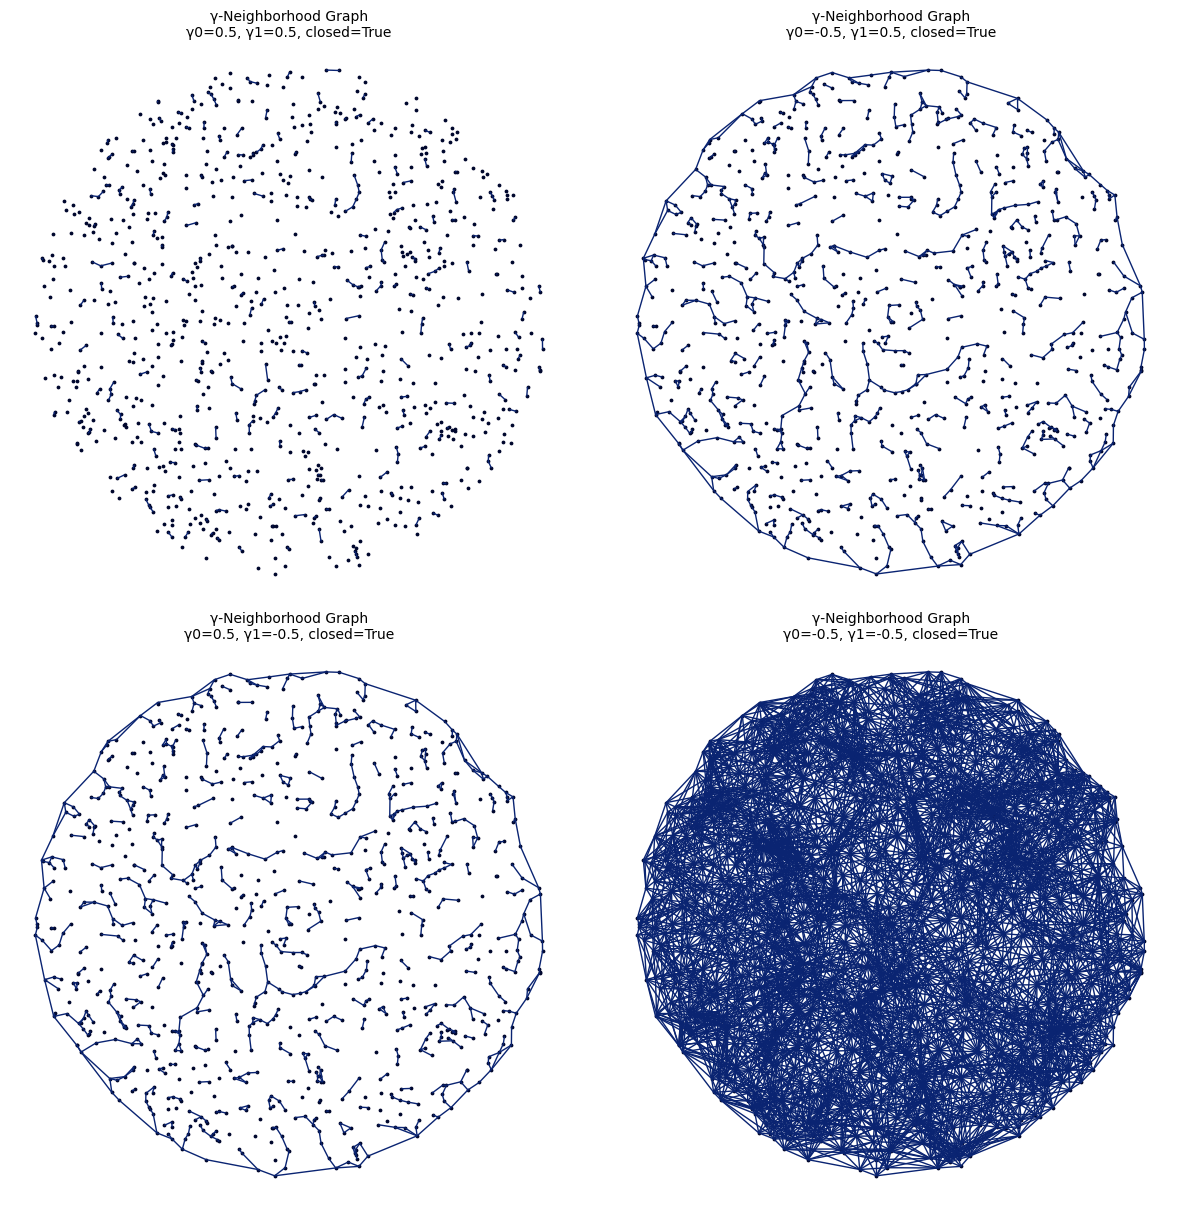
axs_flat = np.ravel(axs)  # length 4, each element is a single Axes

gammas = [(0.5, 0.5), (-0.5, 0.5), (0.5, -0.5), (-0.5, -0.5)]

for ax, (gamma0, gamma1) in zip(axs_flat, gammas):
    t0 = time.perf_counter()
    H = pg.Gamma_Graph(uniform_sphere, gamma0=gamma0, gamma1=gamma1, closed=True, block_size=128)
    H.draw(ax=ax, details=True)
    t1 = time.perf_counter()
    print(f"gamma0={gamma0}, gamma1={gamma1}\t{t1 - t0:.4f}s")

plt.show()
gamma0=0.5, gamma1=0.5	0.0873s
gamma0=-0.5, gamma1=0.5	0.1033s
gamma0=0.5, gamma1=-0.5	13.0758s
gamma0=-0.5, gamma1=-0.5	11.3831s
gammas = [
    [(0.1, 0.1), (-0.1, 0.1)],
    [(0.1, -0.1), (-0.1, -0.1)],
]

fig, axs = plt.subplots(2, 2, figsize=(12, 12), constrained_layout=True)

for i in range(2):
    for j in range(2):
        gamma0, gamma1 = gammas[i][j]
        H = pg.Gamma_Graph(uniform_sphere, gamma0=gamma0, gamma1=gamma1, closed=True, block_size=128)
        H.draw(ax=axs[i, j], details=True)

plt.show()