Gamma Graph#
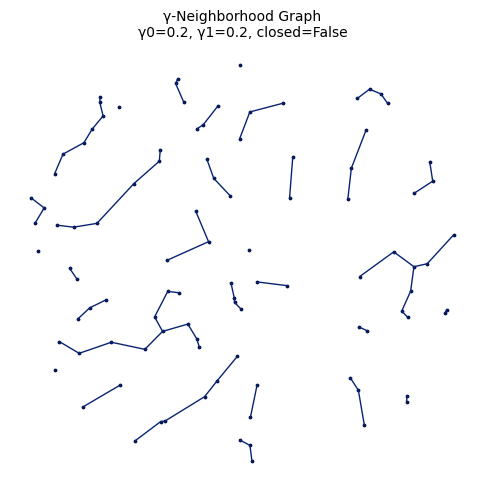
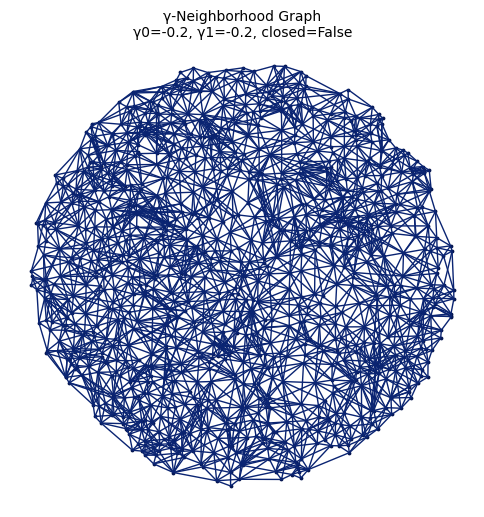
Se muestran diferentes ejemplos de los gamma vecindarios para diferentes \(n\) puntos, \(\gamma_0\), \(\gamma_1\).
import proximitygraphs as pg
import time
vcolor = '#051650'
ecolor = '#0A2472'

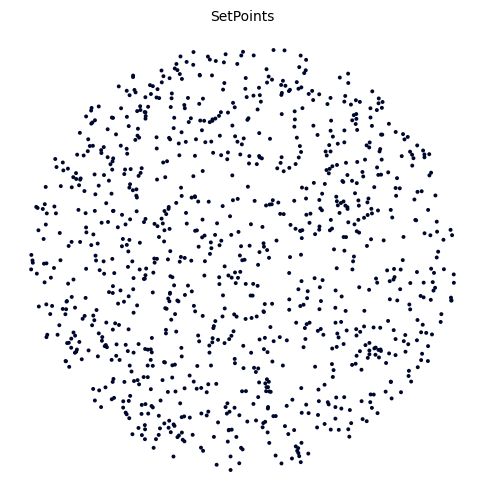
uniform_sphere = pg.SetPoints.uniform_sphere(seed=0, n=1000)
uniform_sphere.draw(figsize=(6,6))
(<Figure size 600x600 with 1 Axes>, <Axes: title={'center': 'SetPoints'}>)
start = time.time()
H = pg.Gamma_Graph(uniform_sphere, gamma0=-0.2, gamma1=-0.2)
H.draw(title=True, details=True, figsize=(6,6), v_size=3, e_size=1, v_color=vcolor, e_color=ecolor, fontsize=10)
end = time.time()
print("Time taken: ", end - start)
Time taken: 29.84161901473999
start = time.time()
H = pg.Gamma_Graph(uniform_sphere, gamma0=0.2, gamma1=0.2)
H.draw(title=True, details=True, figsize=(6,6), v_size=3, e_size=1, v_color=vcolor, e_color=ecolor, fontsize=10)
end = time.time()
print("Time taken: ", end - start)
Time taken: 0.025593996047973633