draw2 method#
Se compara el draw2 con el draw original.
import proximitygraphs as pg
config = {
            'point_generator': {
                'name': 'normal_dist',
                'params': {'n': 500, 'dims': 2}
            },
            'transformations': [
                {
                    'name': 'perturb',
                    'params': {'radius': 0.25}
                }
            ],
            'graph': {
                'type': 'ProximityGraph',
                'name': 'Beta_Skeleton',
                'params': {'beta': 1.5}
            }
        }

points, graph = pg.Experiment(config).run()
import time

start_time = time.time()
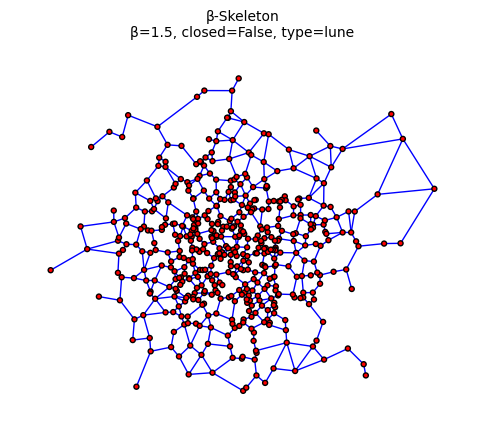
graph.draw(figsize=(6, 6), v_size=5, e_size=1, v_color='red', e_color='blue', title=True, details=True, fontsize=10)
end_time = time.time()

print(f"Execution time: {end_time - start_time} seconds")
Execution time: 2.331360340118408 seconds
import time

start_time2 = time.time()
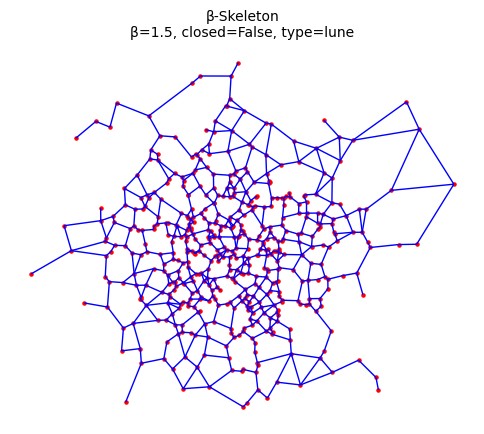
graph.draw2(figsize=(6, 6), v_size=5, e_size=1, v_color='red', e_color='blue', title=True, details=True, fontsize=10)
end_time2 = time.time()

print(f"Execution time: {end_time2 - start_time2} seconds")
Execution time: 0.0128326416015625 seconds
import matplotlib.pyplot as plt

# Calculate execution times
time_draw = end_time - start_time
time_draw2 = end_time2 - start_time2

# Print metrics
print(f"draw execution time: {time_draw:.4f} seconds")
print(f"draw2 execution time: {time_draw2:.4f} seconds")

speedup = time_draw / time_draw2
print(f"draw2 is {speedup:.2f} times faster than draw. Wow!")

# Create a bar plot to compare the execution times
methods = ['draw', 'draw2']
times = [time_draw, time_draw2]

plt.figure(figsize=(8, 5))
plt.bar(methods, times, color=['blue', 'green'])
plt.ylabel('Execution Time (seconds)')
plt.title('Comparison of Execution Times for draw and draw2')
plt.show()
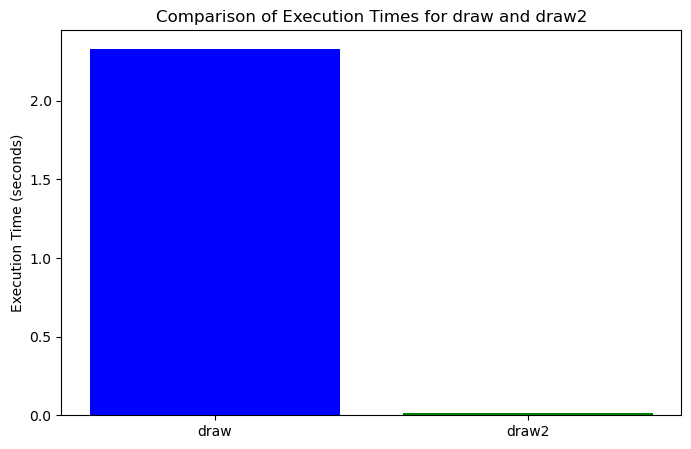
draw execution time: 2.3314 seconds
draw2 execution time: 0.0128 seconds
draw2 is 181.67 times faster than draw. Wow!
Customization#
vcolor = '#051650'
ecolor = '#0A2472'
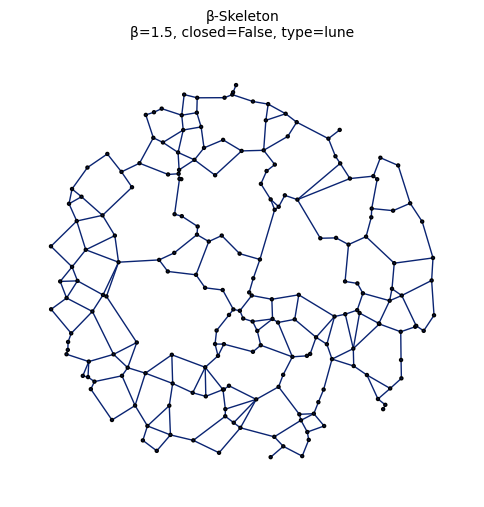
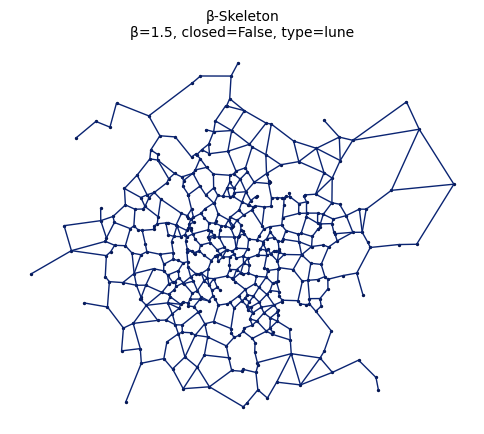
graph.draw2(figsize=(6, 6), v_size=2, e_size=1, v_alpha=1, e_alpha=1, v_color=vcolor, e_color=ecolor, title=True, details=True, fontsize=10)
(<Figure size 600x600 with 1 Axes>,
 <Axes: title={'center': 'beta-Skeleton\nbeta=1.5, closed=False, type=lune'}>)
from proximitygraphs import SetPoints

uniform_sphere = SetPoints.uniform_sphere(n=200, dims = 2, seed=0)
from proximitygraphs import Alpha_Hull, Alpha_Shape

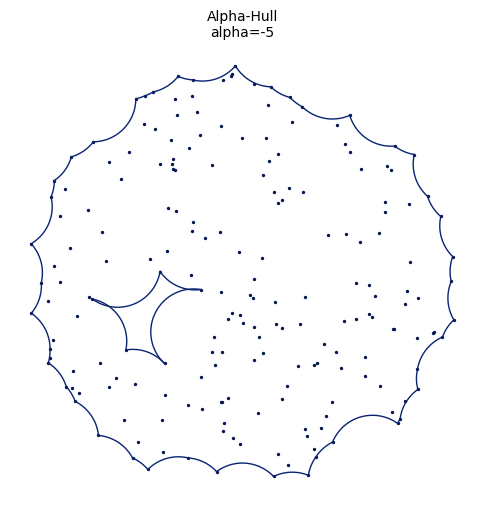
H = Alpha_Hull(uniform_sphere, alpha=-5, n_points_per_arc=50)
H.draw(title=True, details=True, figsize=(6,6), v_size=2, e_size=1, v_color=vcolor, e_color=ecolor, fontsize=10)
(<Figure size 600x600 with 1 Axes>,
 <Axes: title={'center': 'Alpha-Hull\nalpha=-5'}>)
from proximitygraphs import DelaunayG


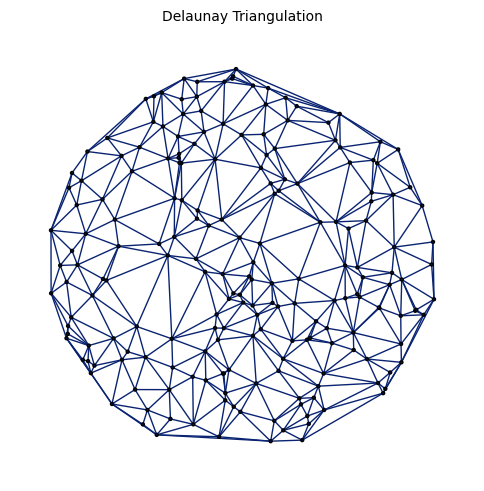
H = DelaunayG(uniform_sphere)
H.draw(title=True, details=True, figsize=(6,6), v_size=3, e_size=1, v_color=vcolor, e_color=ecolor, fontsize=10)
(<Figure size 600x600 with 1 Axes>,
 <Axes: title={'center': 'Delaunay Triangulation'}>)
from proximitygraphs import Beta_Skeleton

H = Beta_Skeleton(uniform_sphere)
H.draw(title=True, details=True, figsize=(6,6), v_size=3, e_size=1, v_color=vcolor, e_color=ecolor, fontsize=10)
(<Figure size 600x600 with 1 Axes>,
 <Axes: title={'center': 'beta-Skeleton\nbeta=1.5, closed=False, type=lune'}>)